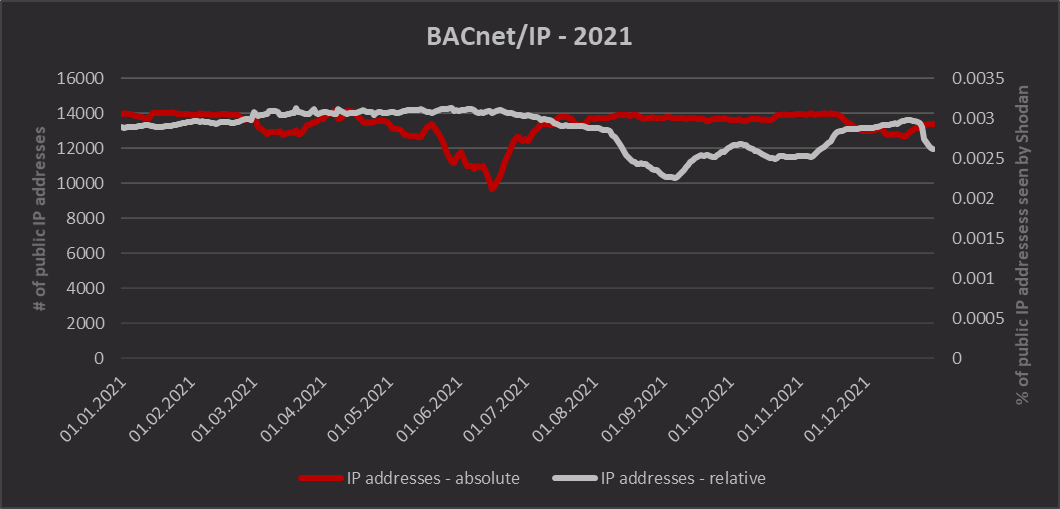
The year 2021 is behind us which means that the time has come for us to take a look at how the internet changed over its 365 days.
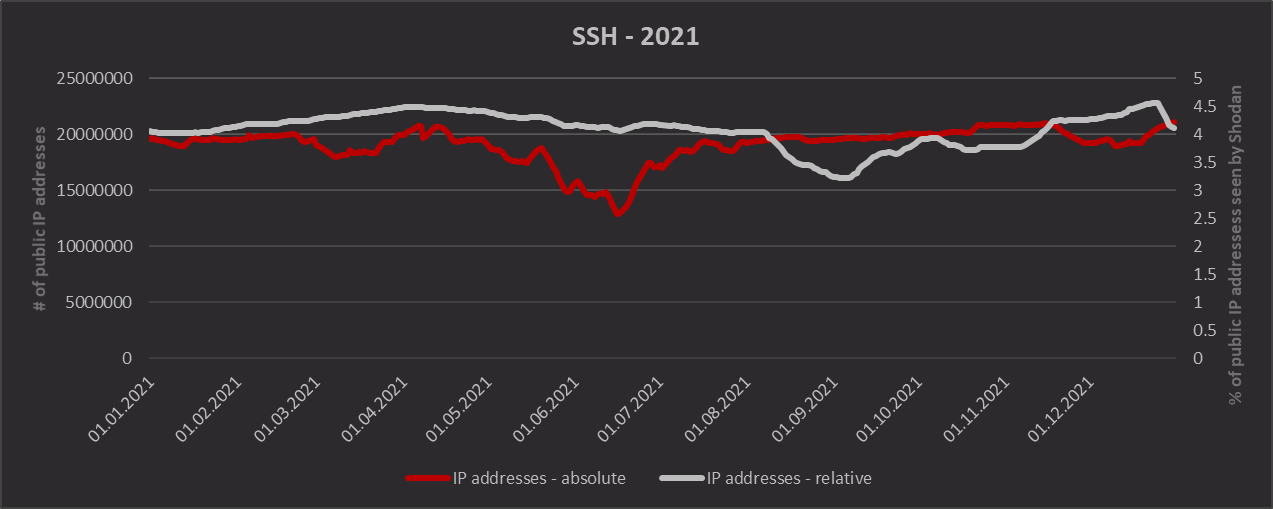
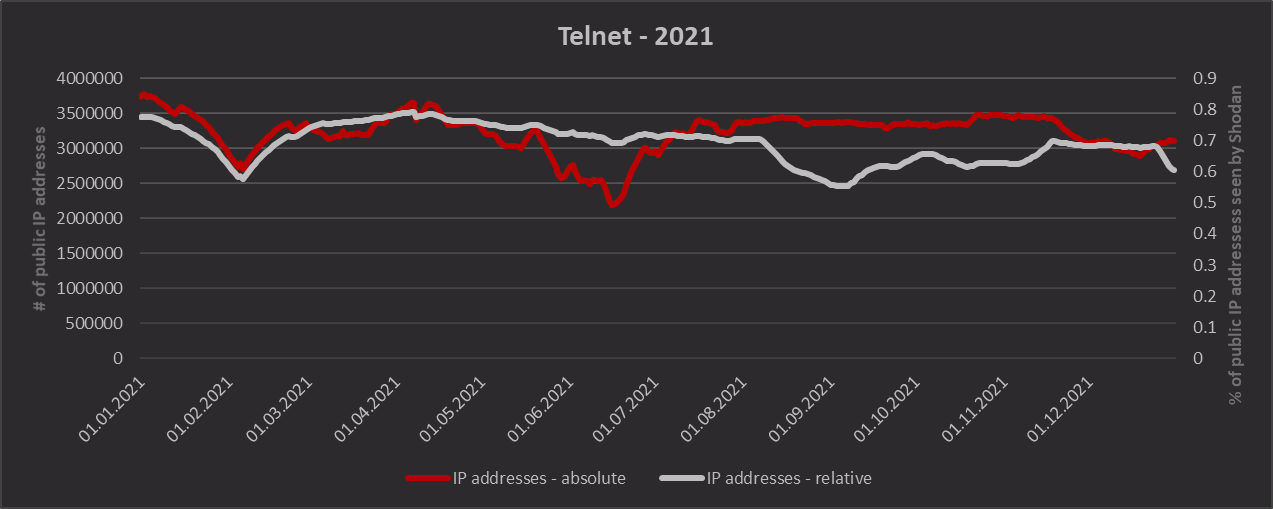
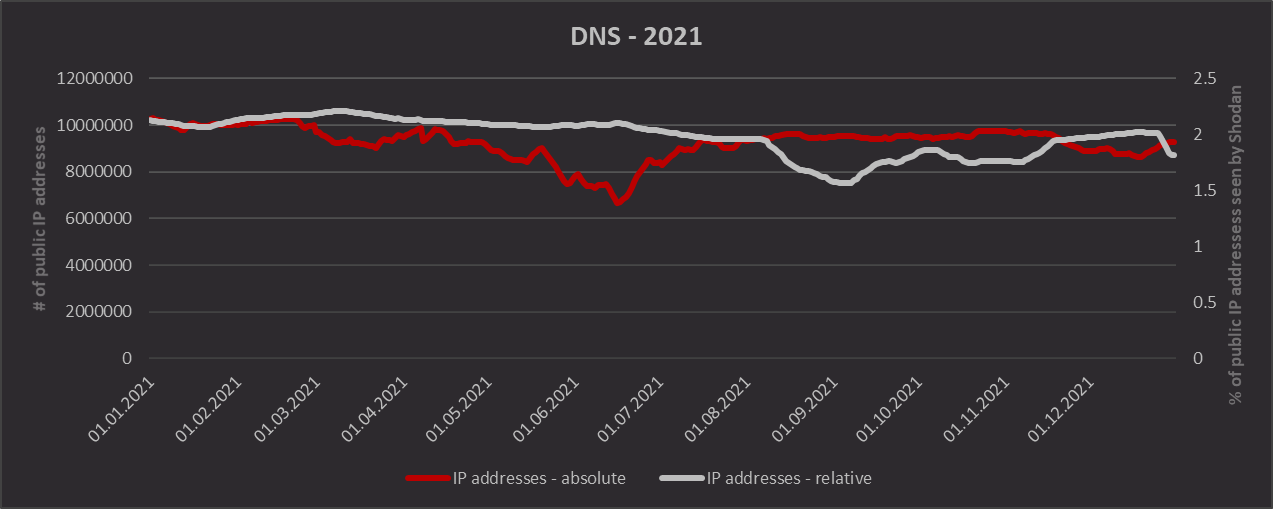
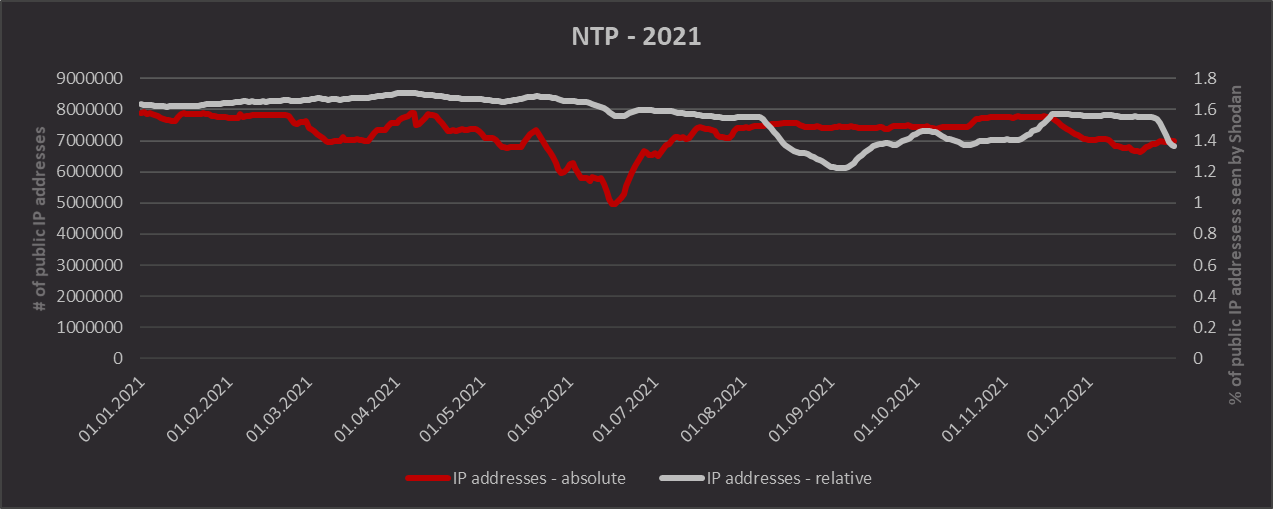
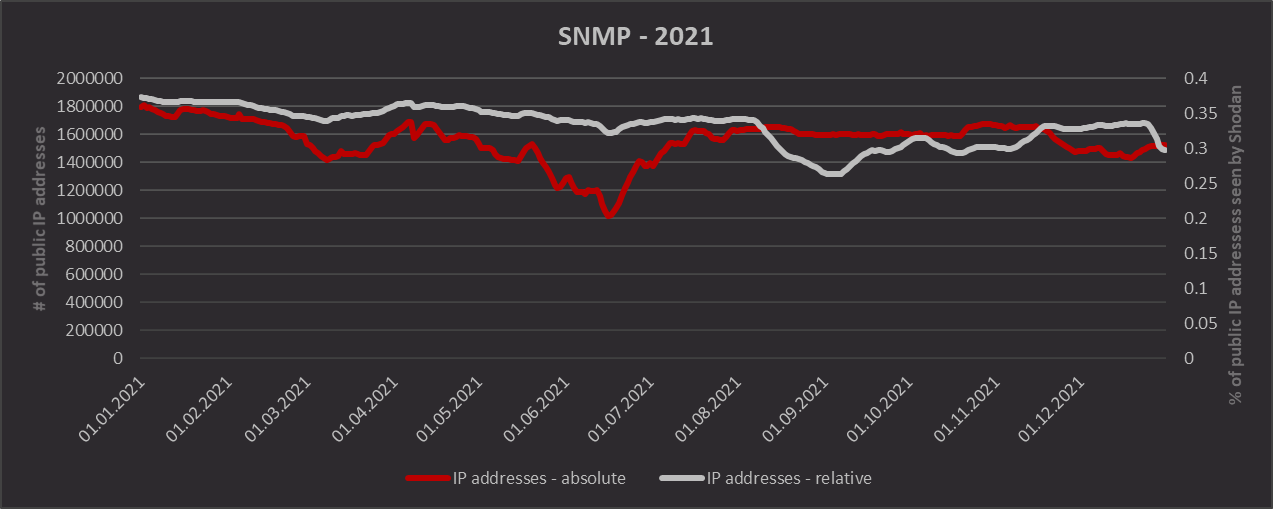
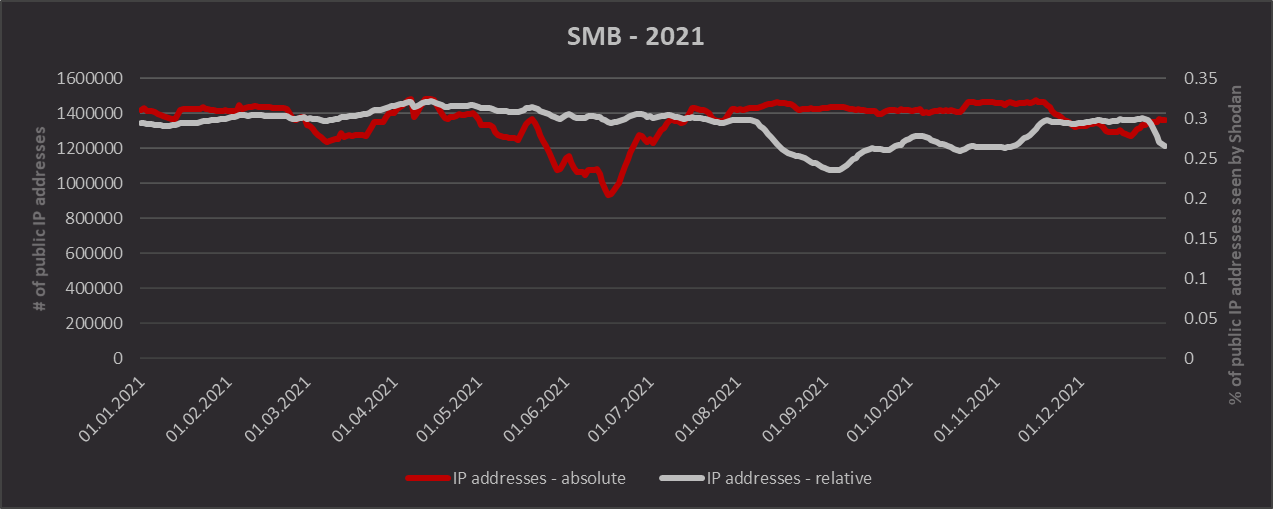
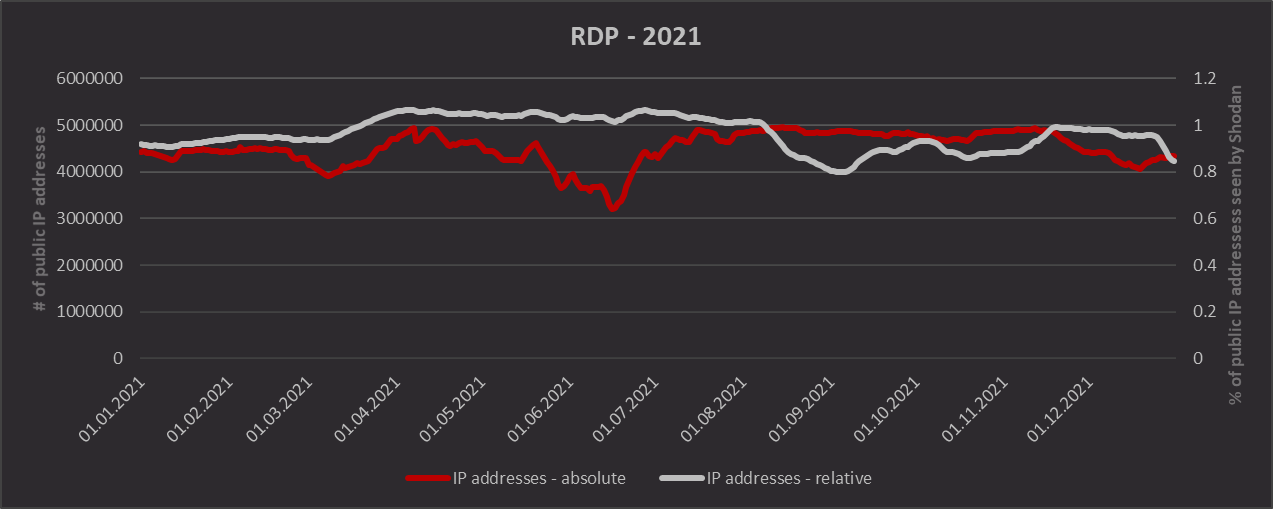
As always, the data, on which the following charts are based, have been gathered using Shodan. Therefore bear in mind that although the charts should give us a good enough view of more significant changes, they may not be completely accurate (see the first post with quarterly statistics.
It should be mentioned that since Shodan started offering a new service called Trends few months back, which enables one to quickly view similar charts as the ones bellow for arbitrary search queries, this may be the last post in the “Open port statistics” series, since these are somewhat superfluous given the new service… Althoug, since Shodan Trends displays only “high-level” charts with significantly lower level of precission (it seems that it uses either an average or a median for each month, whereas the following charts show precise values returned by Shodan on each day in the year), maybe I’ll decide to keep posting these at least on a yearly basis - we’ll see…
Should you be interested in the port situation in the Czech Republic, you may find corresponding charts here.
Bellow, you may find charts for the following protocols and ports:
- SSH (port 22)
- Telnet (port 23)
- DNS (port 53)
- NTP (port 123)
- SNMP (port 161)
- SMB (port 445)
- RDP (port 3389)
Web
- HTTP (port 80)
- HTTPS (port 443)
- TLS 1.3 (port 443)
- TLS 1.2 (port 443)
- TLS 1.1 (port 443)
- TLS 1.0 (port 443)
- SSL 3.0 (port 443)
- SSL 2.0 (port 443)
SSL/TLS
- TLS 1.3 (all ports)
- TLS 1.2 (all ports)
- TLS 1.1 (all ports)
- TLS 1.0 (all ports)
- SSL 3.0 (all ports)
- SSL 2.0 (all ports)
Industrial Control Systems (ICS)
SSH (port 22)
Telnet (port 23)
DNS (port 53)
NTP (port 123)
SNMP (port 161)
SMB (port 445)
RDP (port 3389)
Web
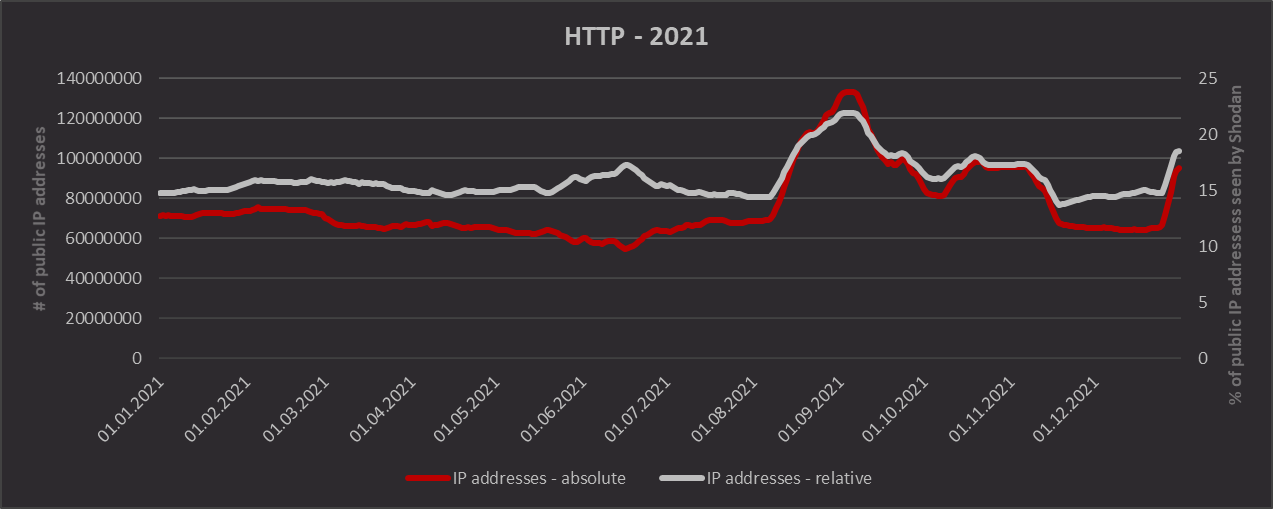
HTTP (port 80)
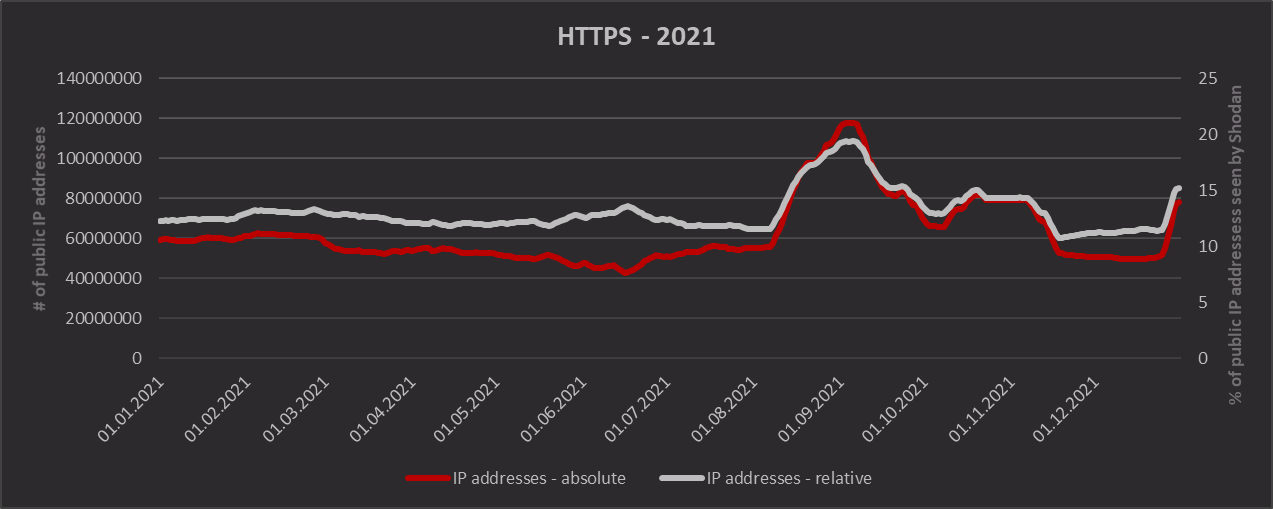
HTTPS (port 443)
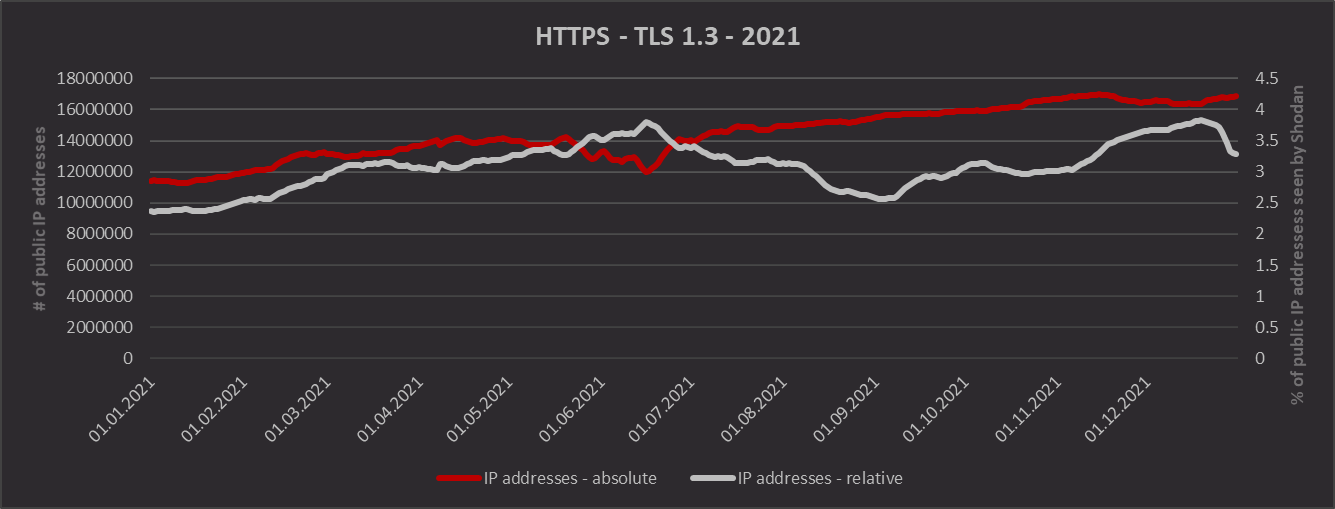
TLS 1.3 (port 443)
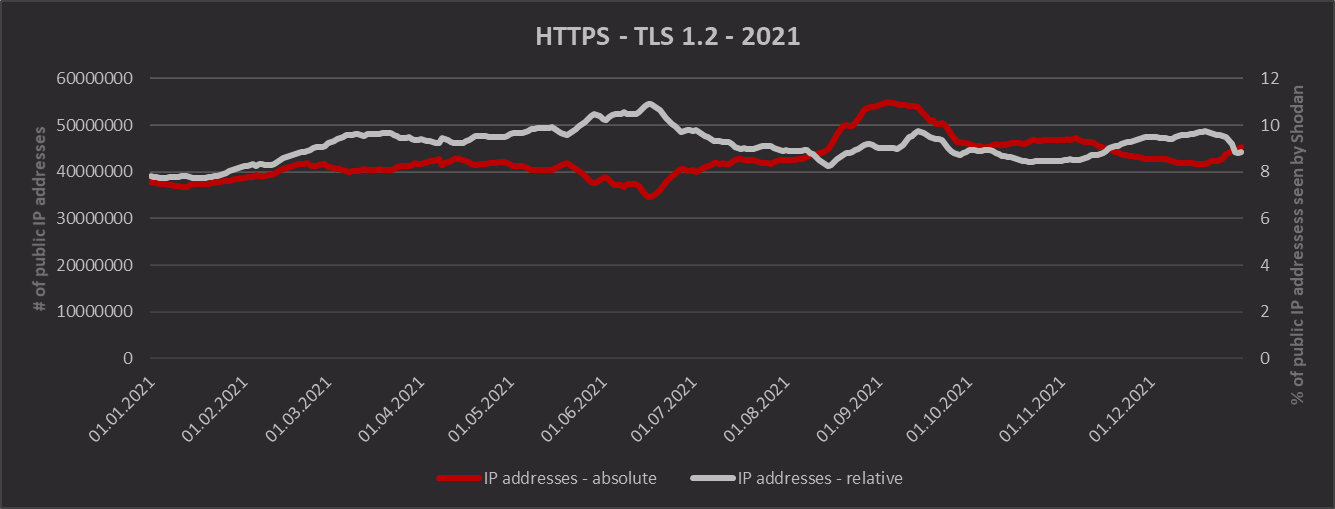
TLS 1.2 (port 443)
TLS 1.1 (port 443)
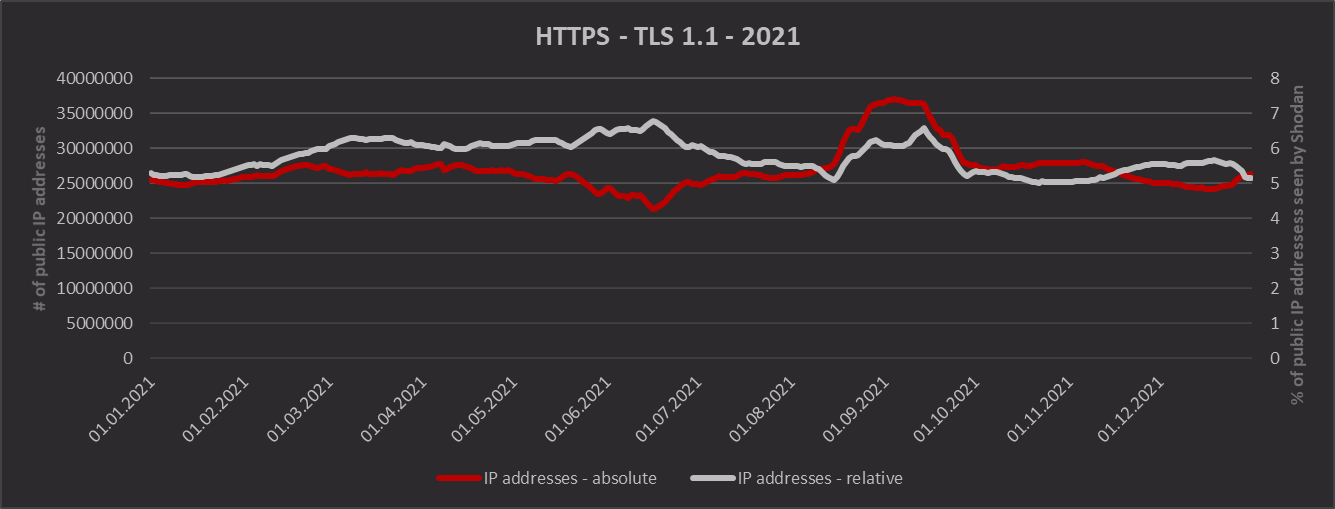
TLS 1.0 (port 443)
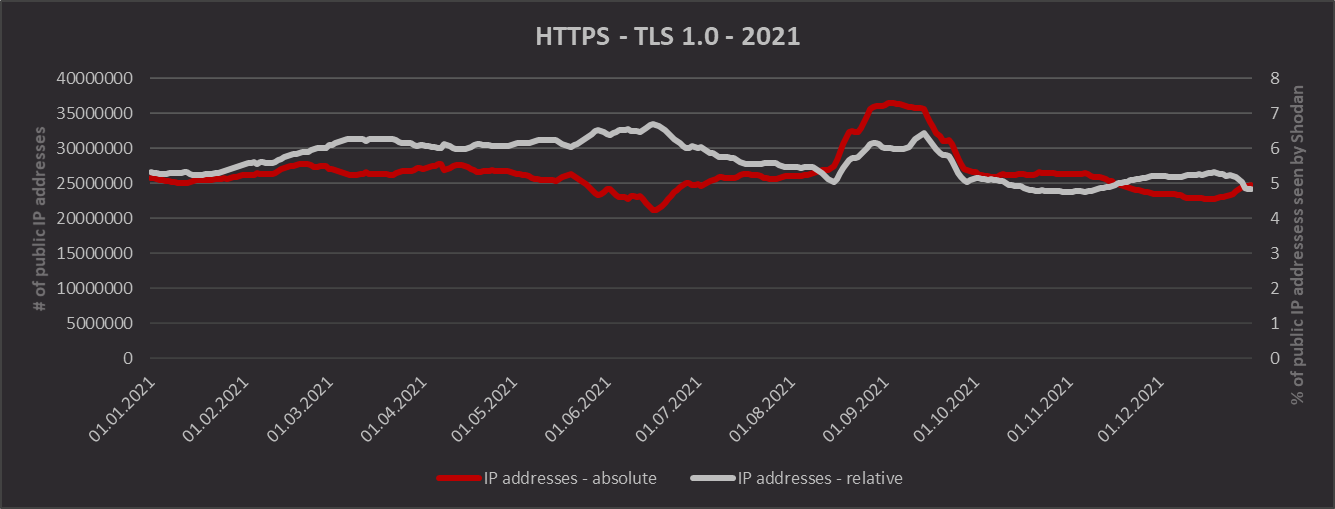
SSL 3.0 (port 443)
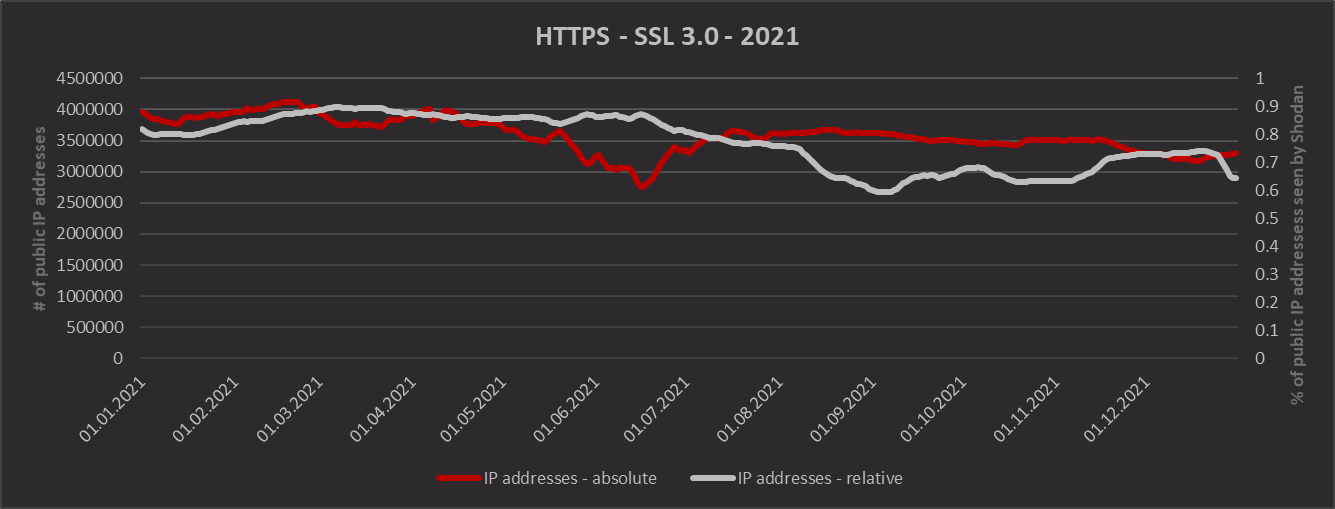
SSL 2.0 (port 443)
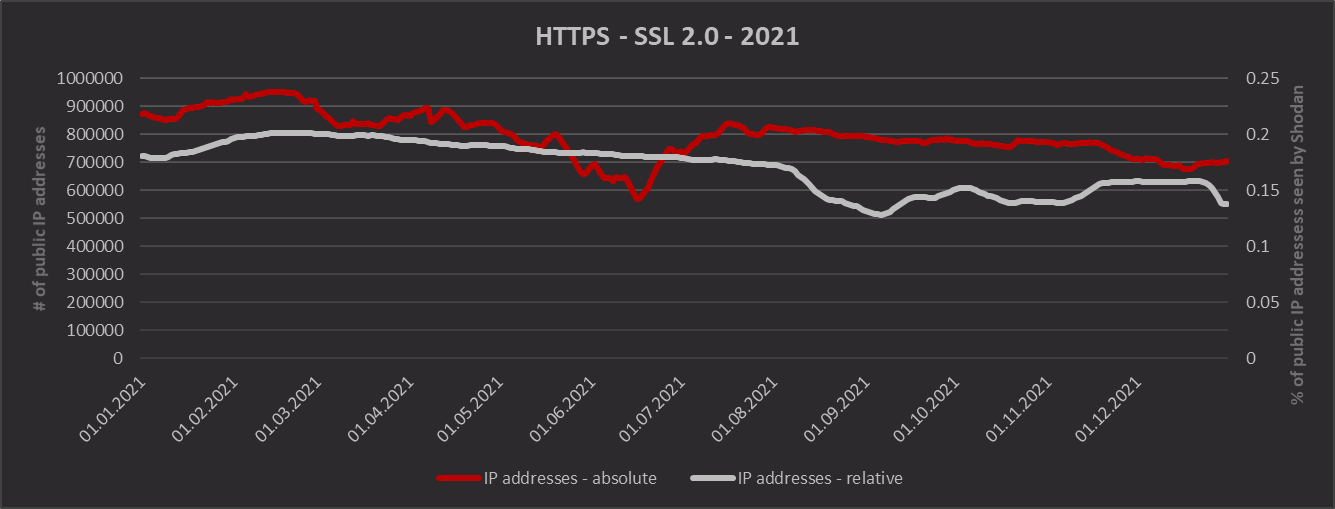
SMTP (port 25)
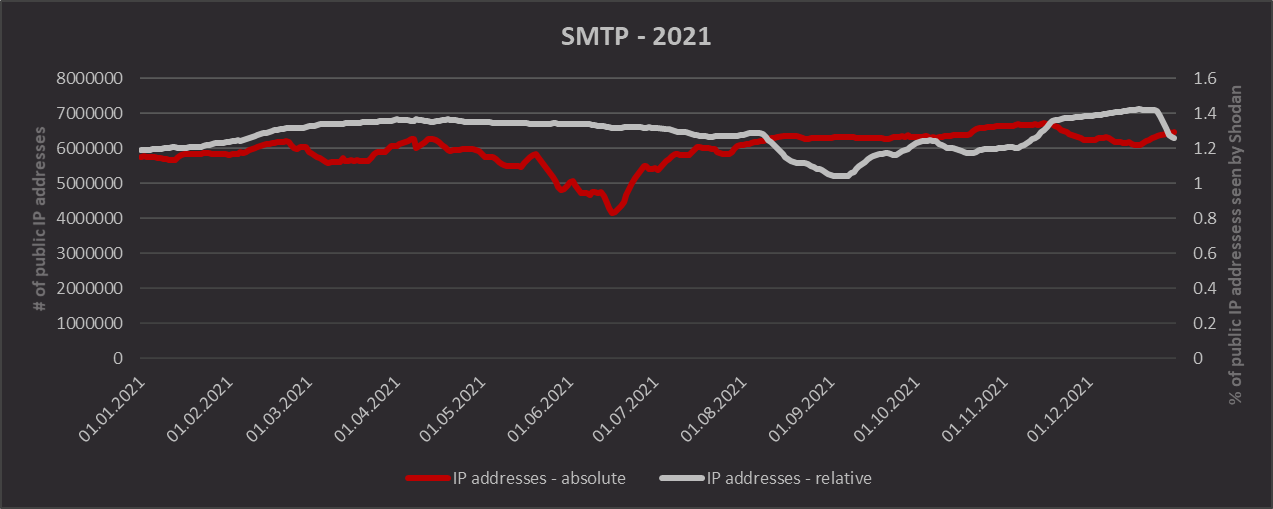
SMTPS (port 465)
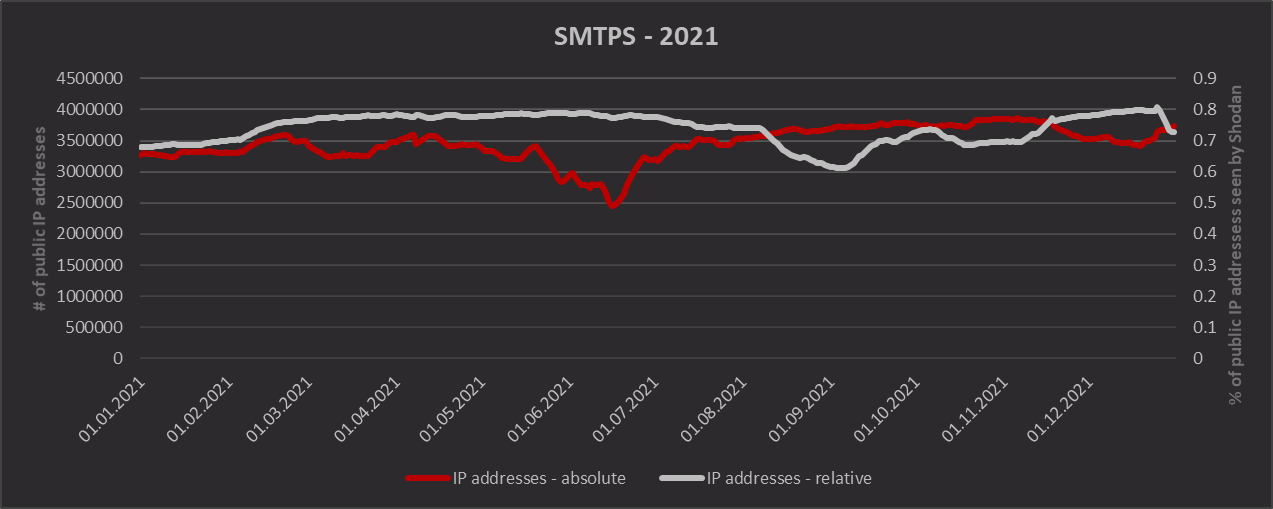
IMAP (port 143)
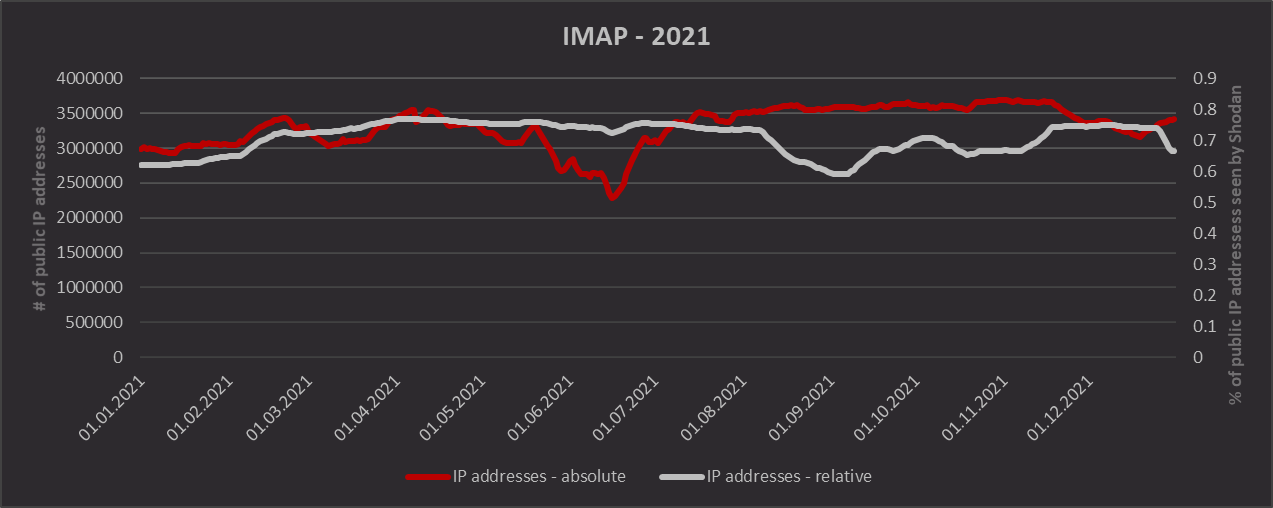
IMAPS (port 993)
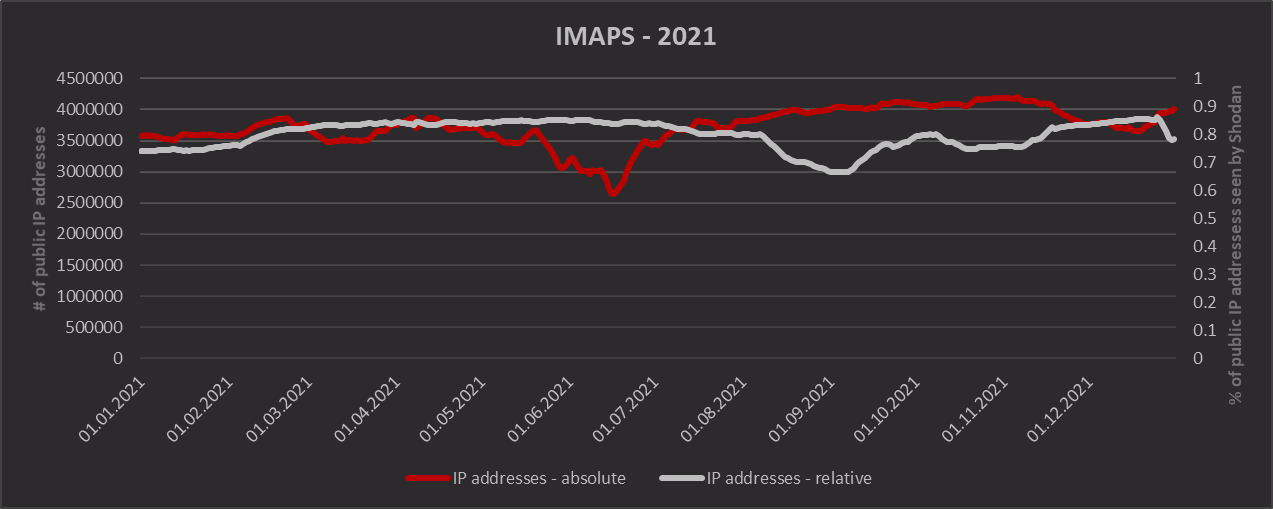
POP3 (port 110)
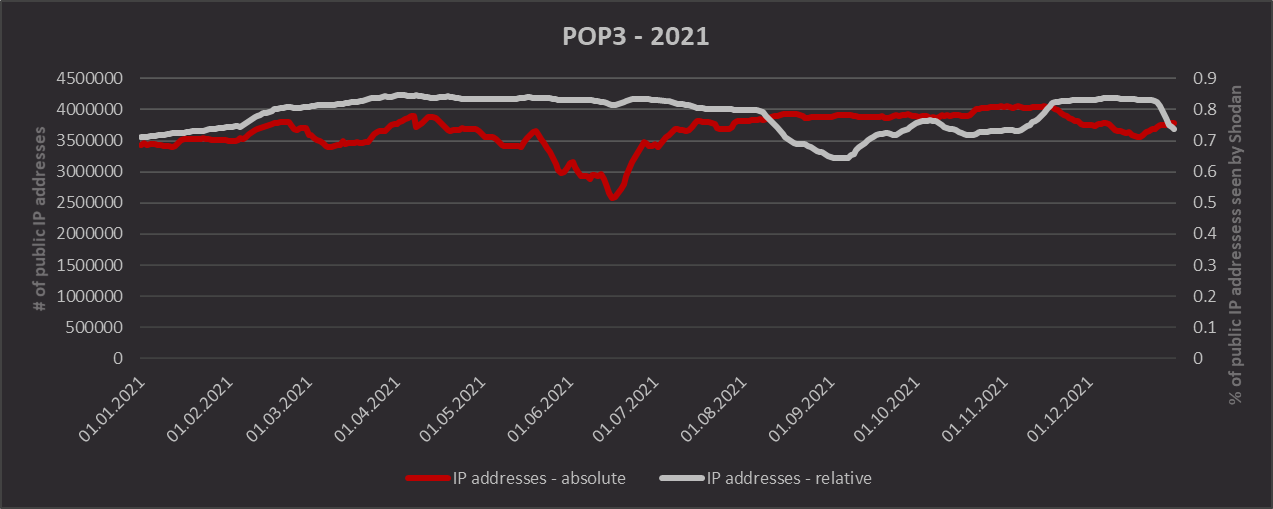
POP3S (port 995)
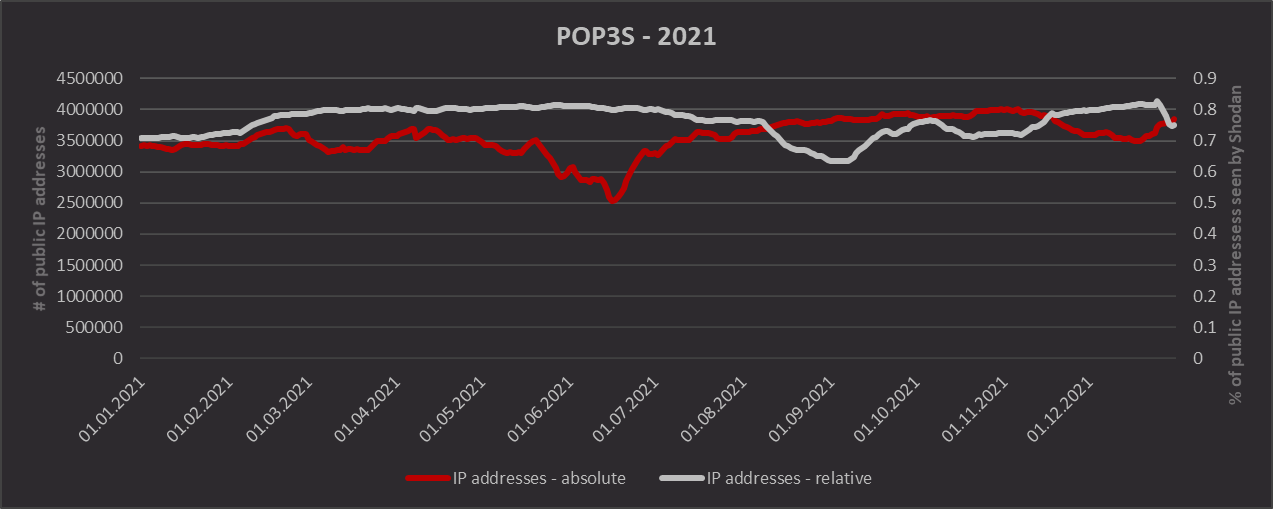
SSL/TLS
TLS 1.3 (all ports)
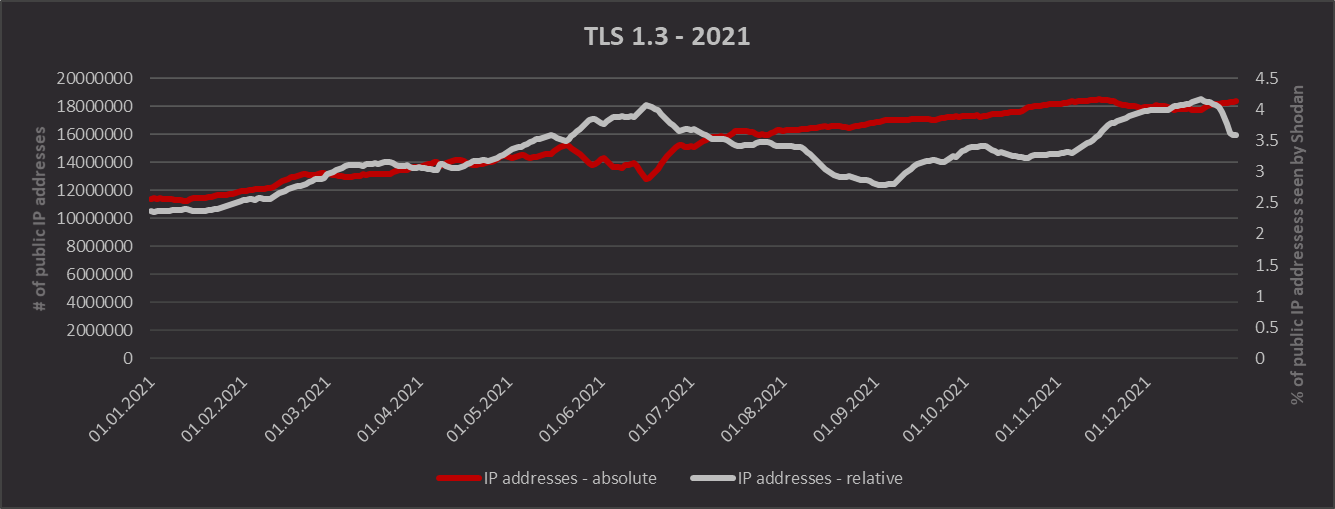
TLS 1.2 (all ports)
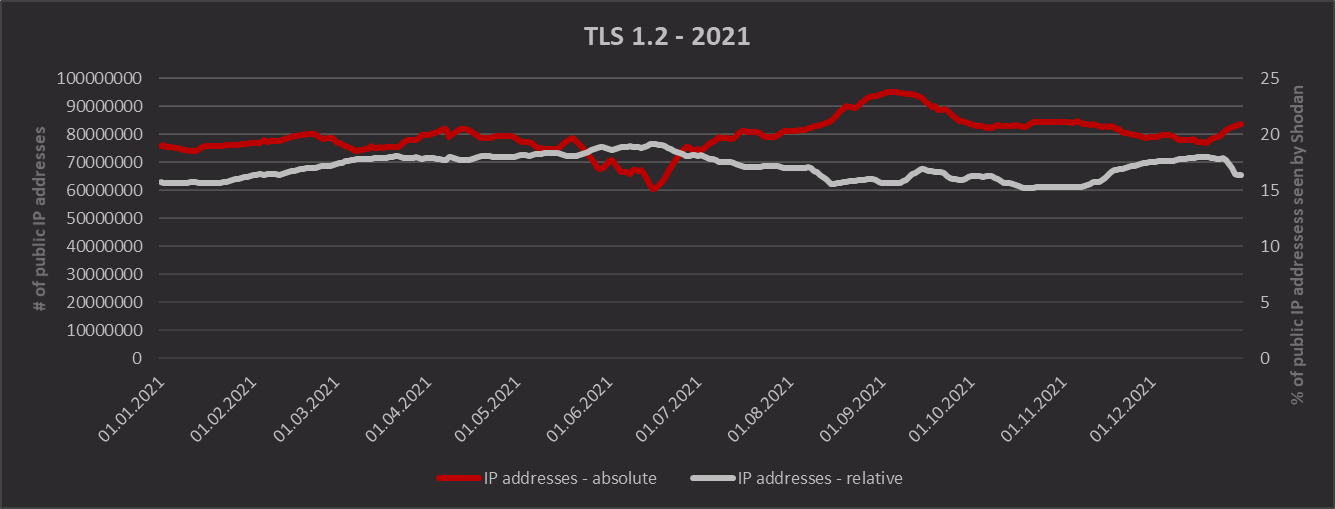
TLS 1.1 (all ports)
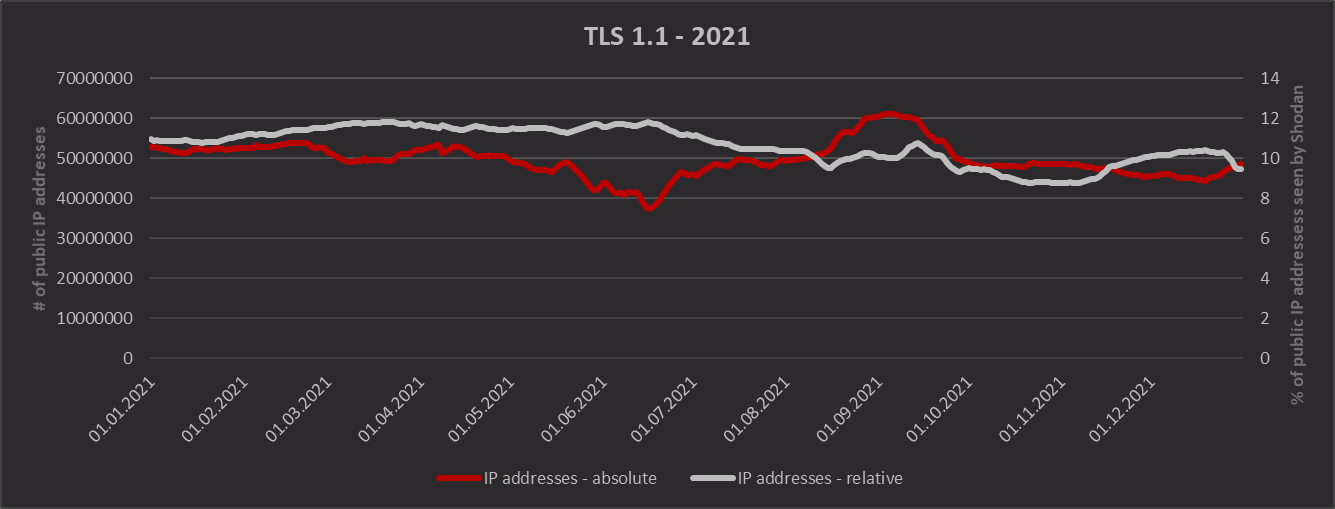
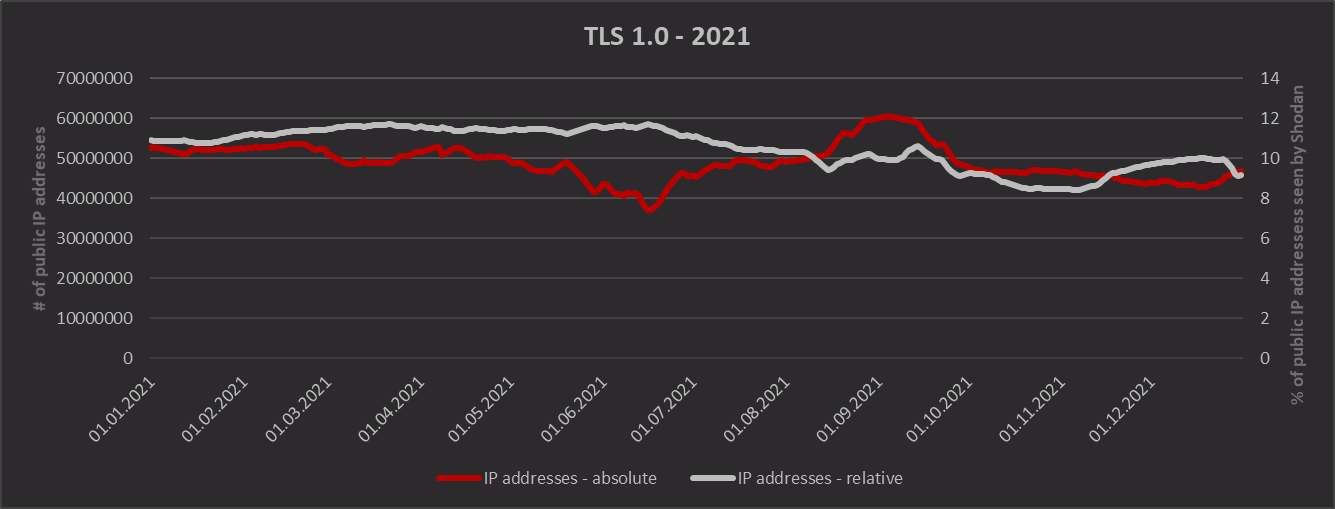
TLS 1.0 (all ports)
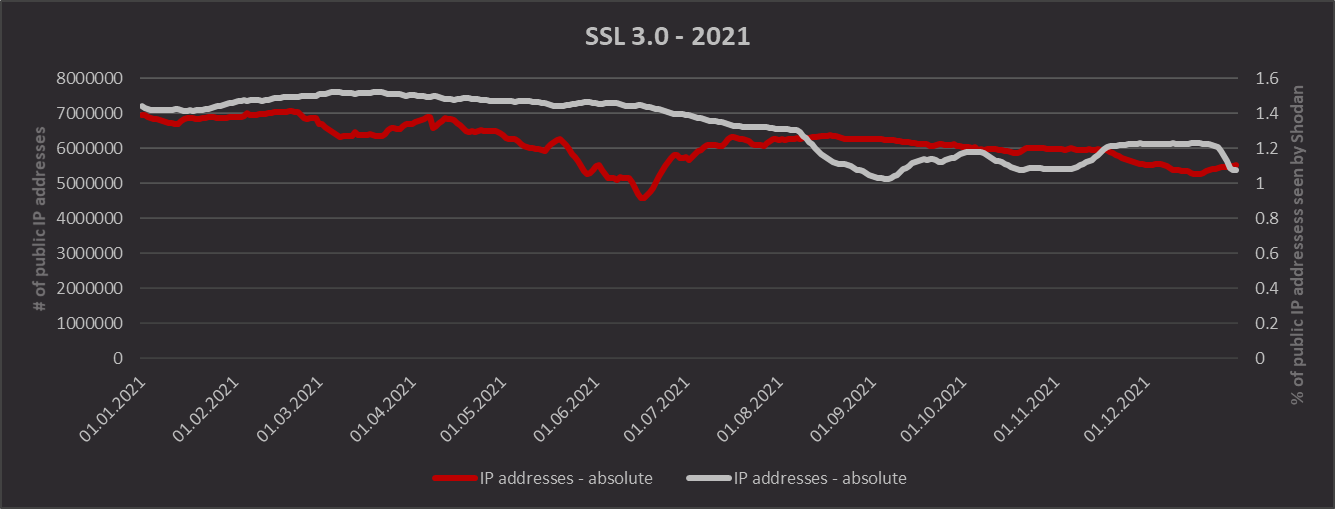
SSL 3.0 (all ports)
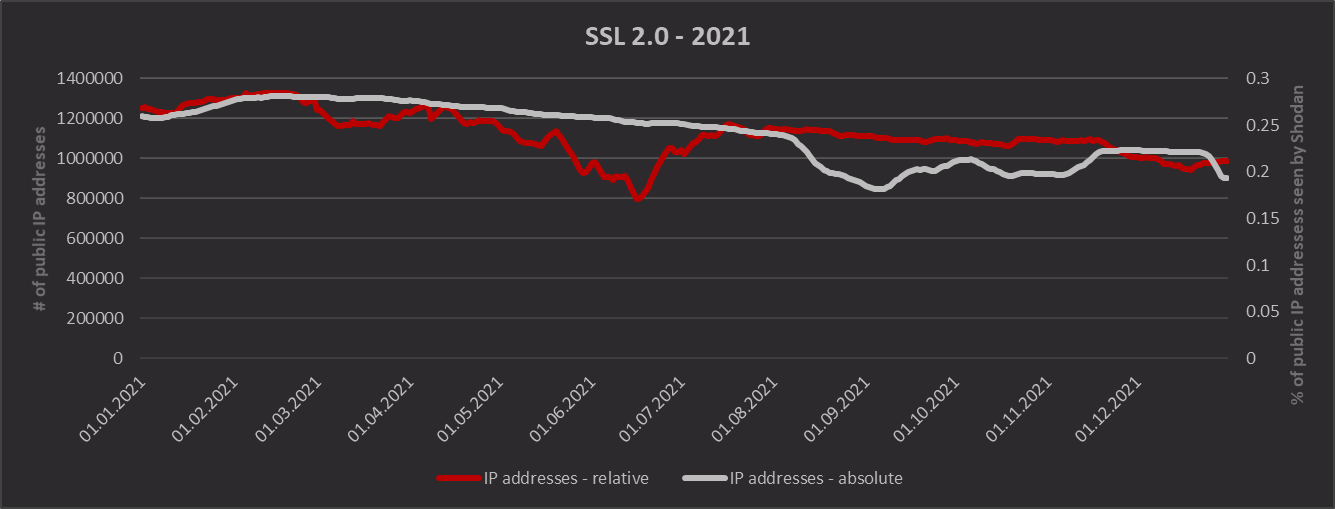
SSL 2.0 (all ports)
Industrial Control Systems
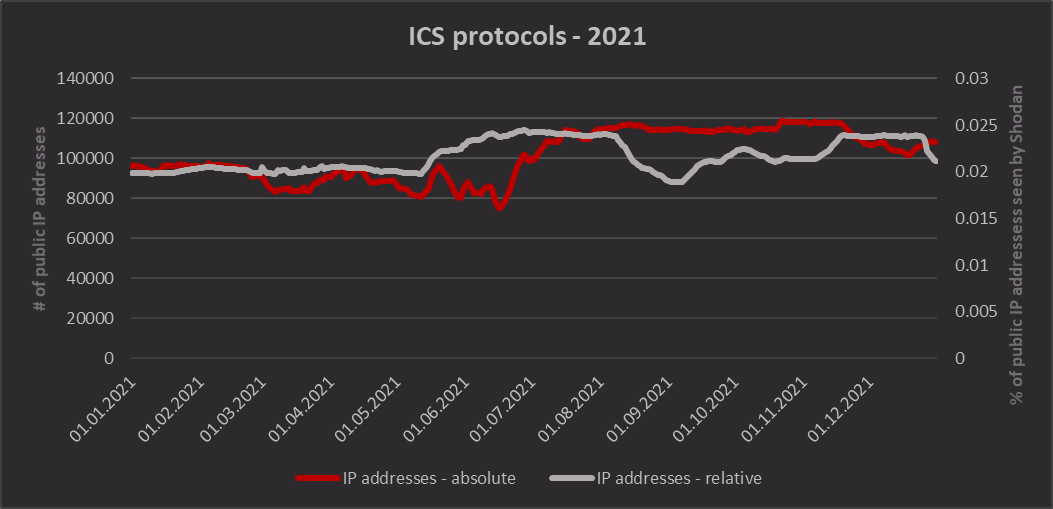
All ICS protocols
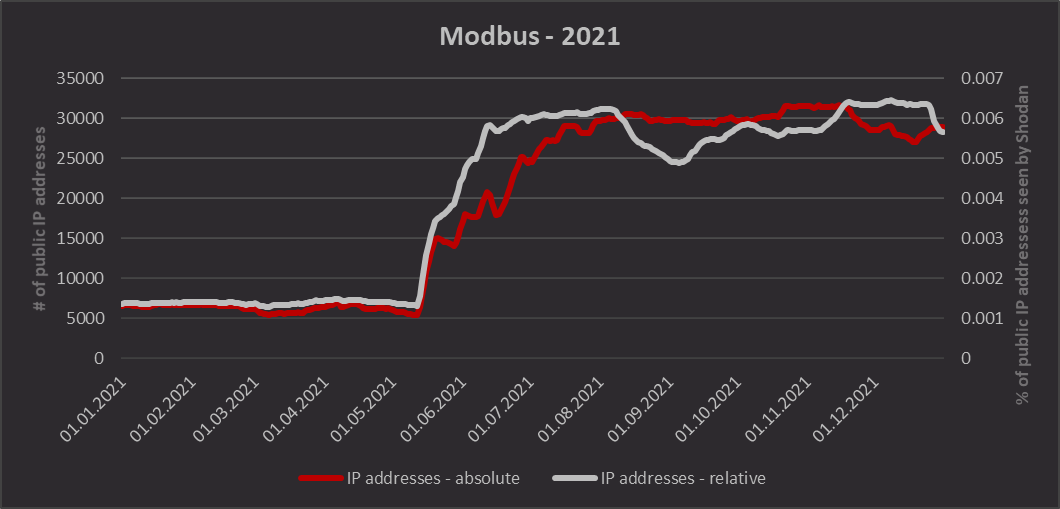
Modbus (port 502)
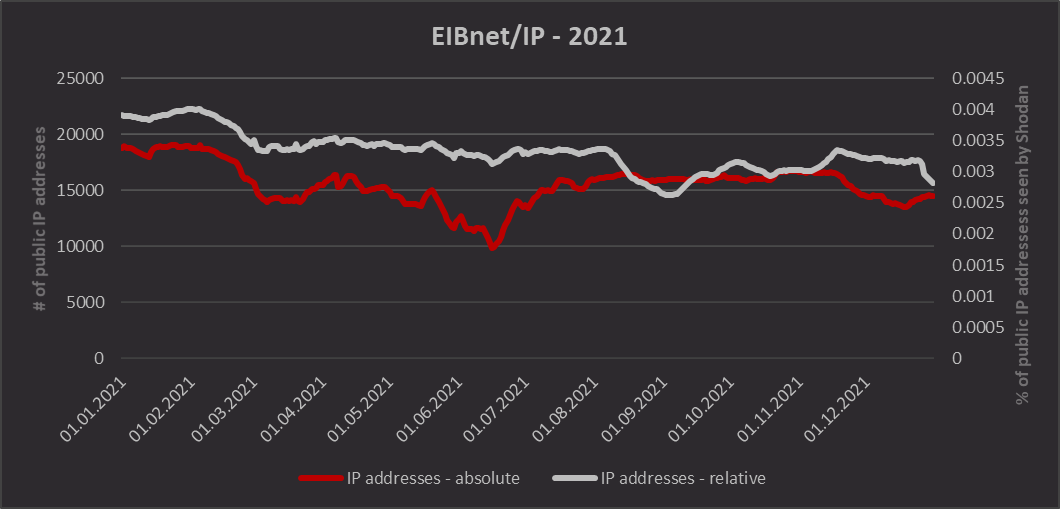
EIBnet/IP (port 3671)
BACnet/IP (port 47808)
