If you’ve read any of my posts about open ports on public IP addresses either here or on the SANS Internet Storm Center website, you probably know that I’m interested in how the internet changes over time and I try to gain at least some understanding of it by analyzing data gathered over time from Shodan.
To this end, I’ve been gathering daily statistics of different open ports/running services accessible on public IP addresses around the world and in different countries for about 18 months now. In order to acquire this data, I wrote Python tool (which I’ve called “TriOp” for obvious reasons), that enables me to quickly create reusable batches of queries for Shodan and automatically gather the numbers of IP addresses, which satisfy these queries. I plan to open source the tool in the future, but I will first need to find some time to clean up the code a little, as although it works just fine in its current version, it is a bit too spaghetti-like in some places for my liking…
In any case, since I have access to this data and I’m probably not the only one who finds the changes in numbers of different open ports interesting, I’ve decided to start publishing quarterly (and perhaps yearly) charts of the numbers of IPs, which have some of the more interesting ports open to the internet.
The list of ports is intentionally small, but if you’d like to see a chart for any of the missing ones next quarter, let me know and I’ll consider adding it.
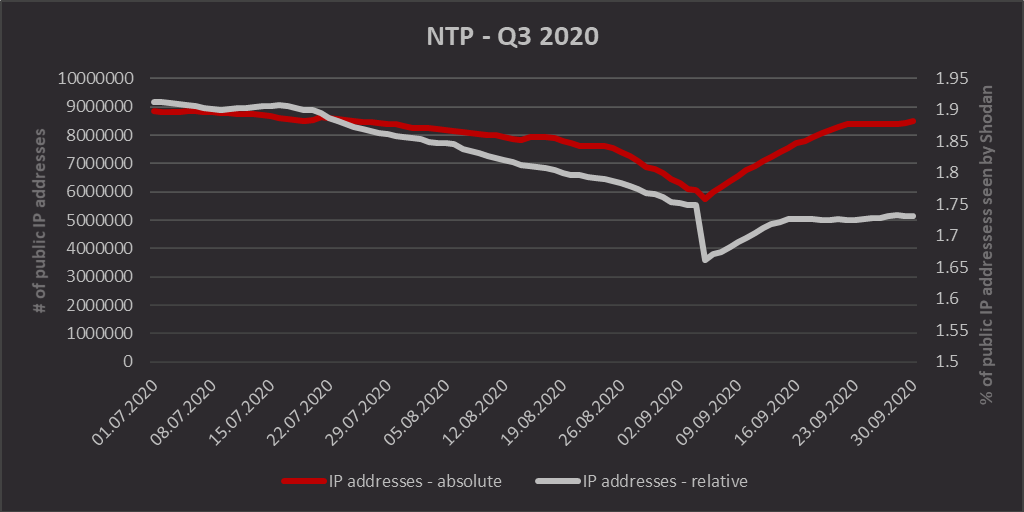
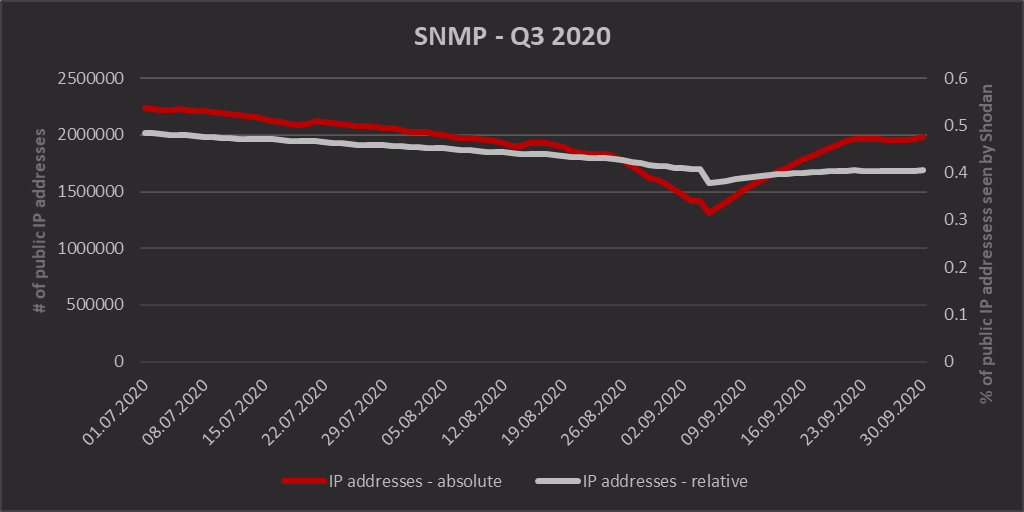
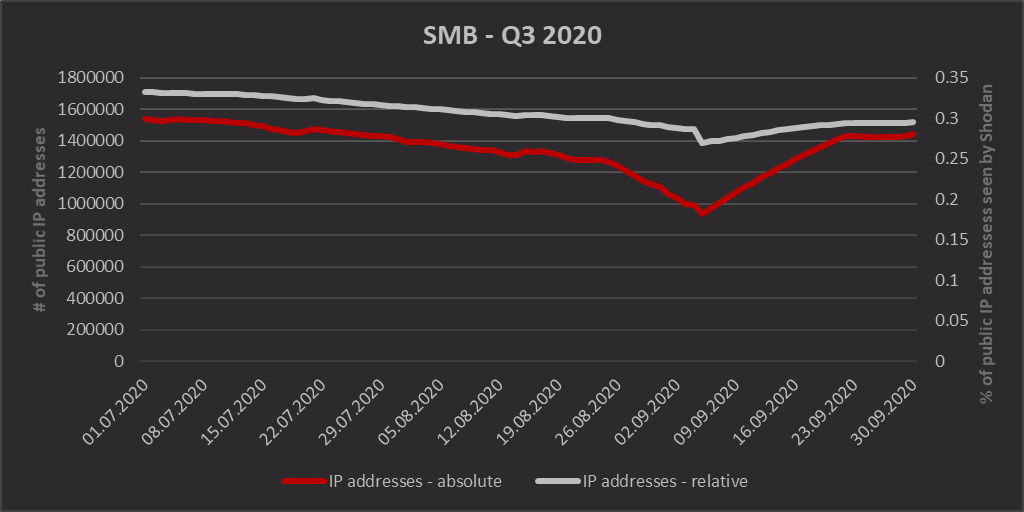
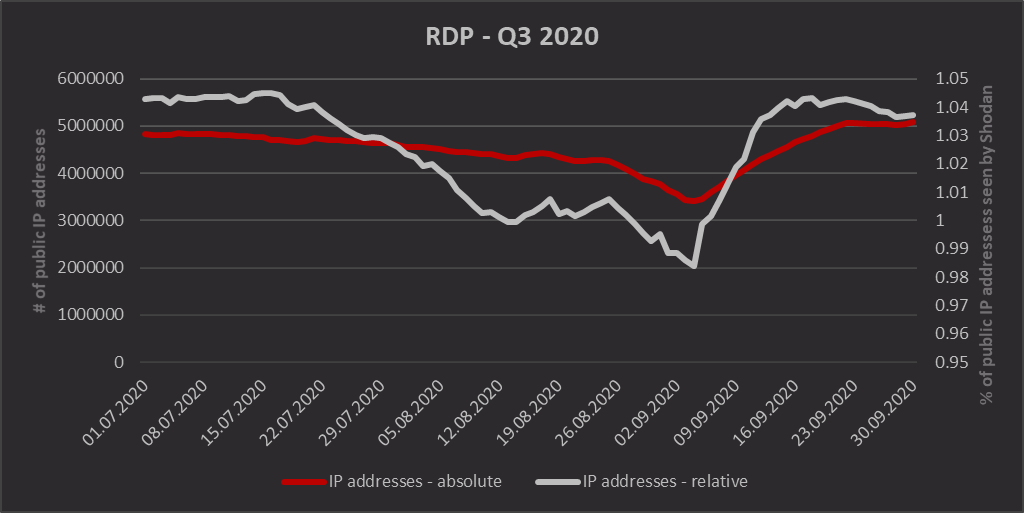
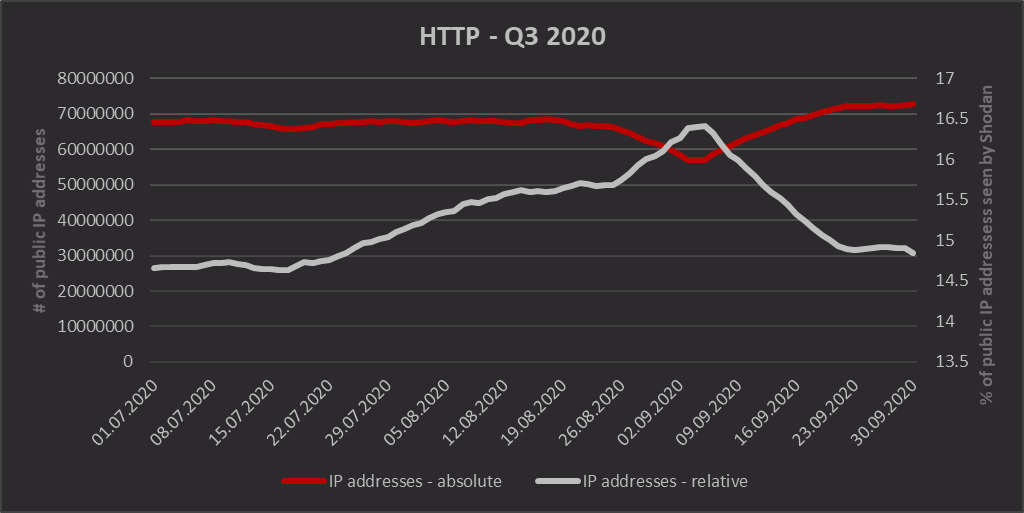
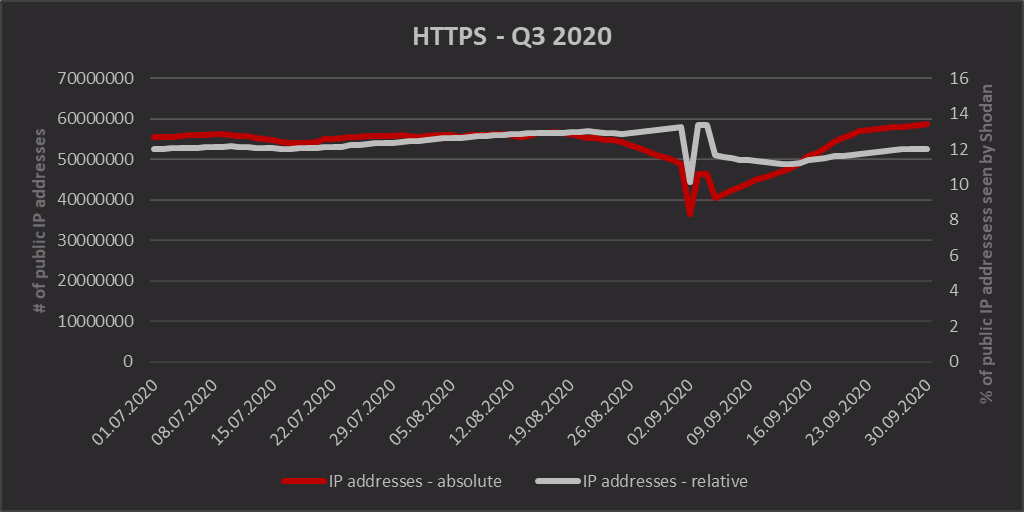
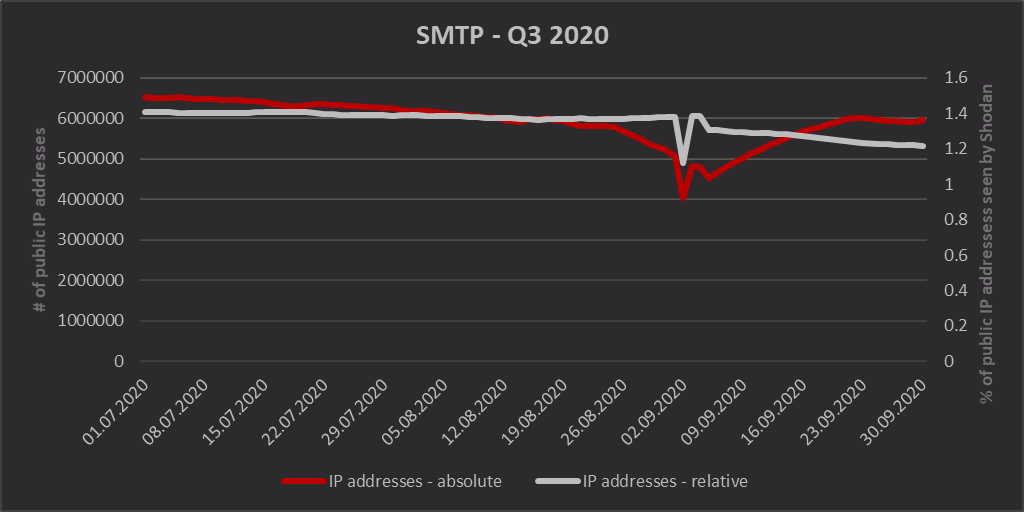
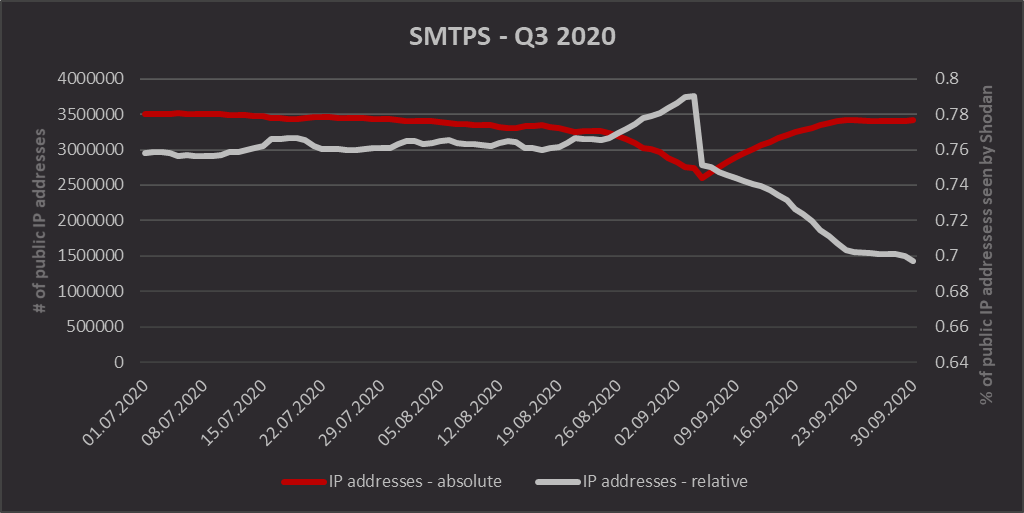
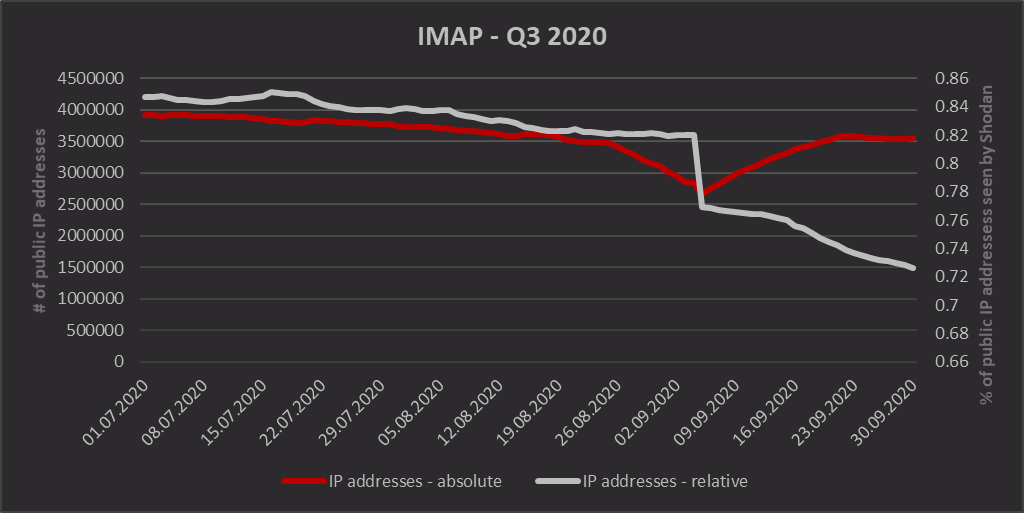
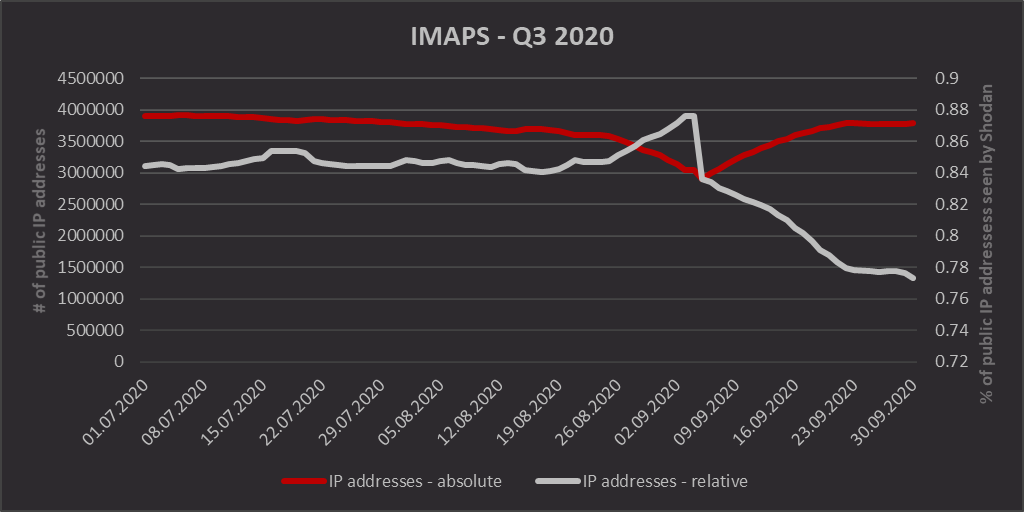
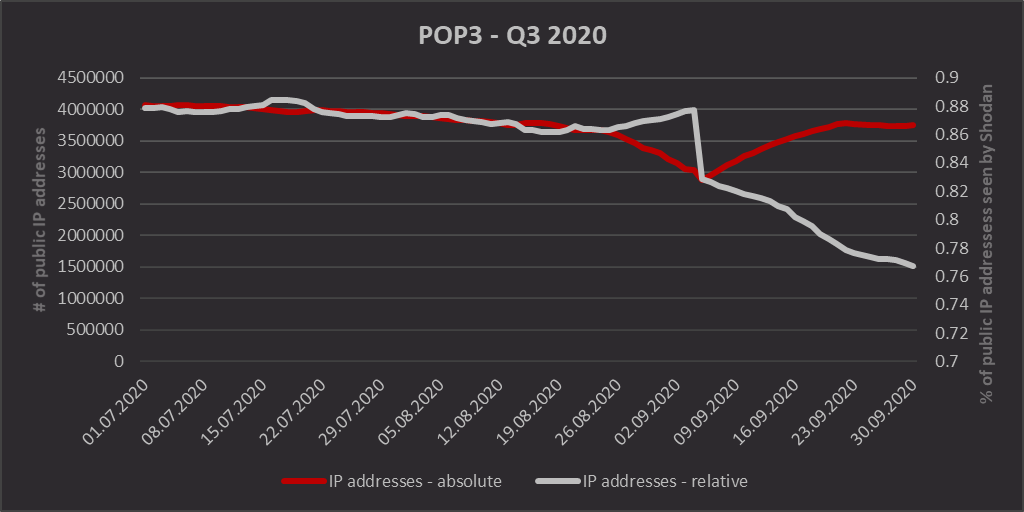
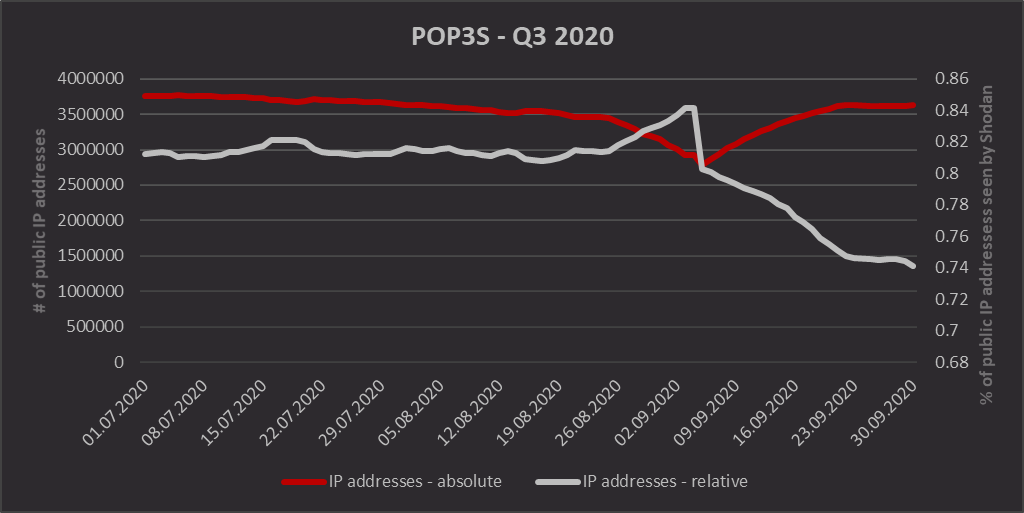
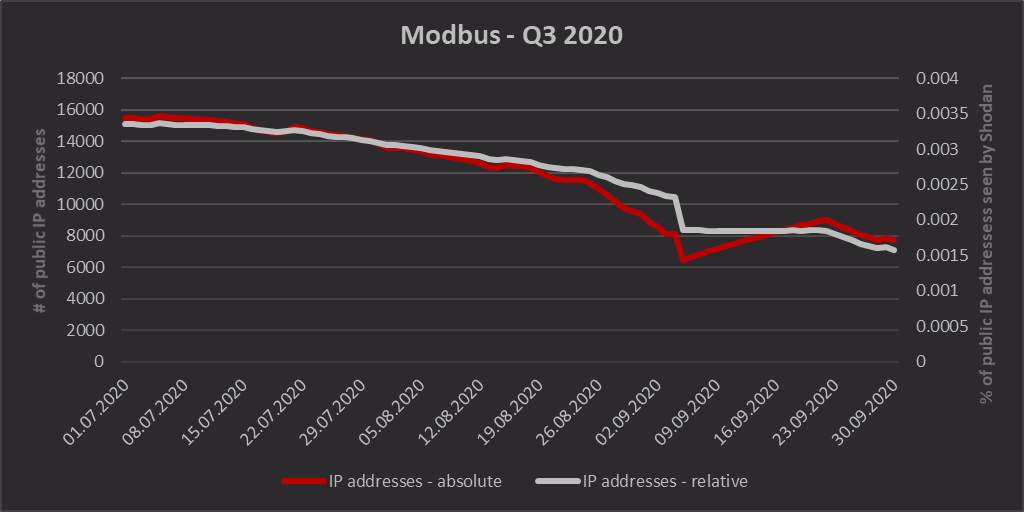
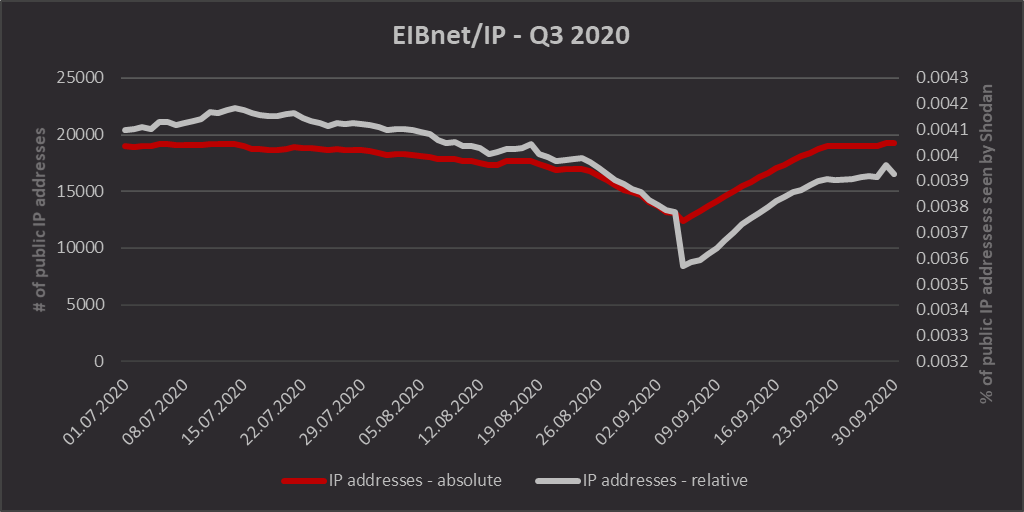
I should mention that due to the way Shodan works, the numbers gathered from it may sometimes increase or decrease sharply and take a while to stabilize (see the first week of September in any of the charts bellow), which does not necessarily represent the real state of affairs. Short discussion of this issue may be found here. To alleviate this issue to at least some degree, I’ve included relative (i.e. percentage of IPs Shodan sees, which have a specific port open) as well as absolute values in all the charts.
Given the limitations of Shodan and the fact that (except for ICS data) the values in the charts are gathered using only port queries (i.e. “port:80”) and are not limited by any service specification, they may be slightly imprecise. Still, the results are certainly interesting and provide at least somewhat accurate look at how the internet changes over time.
Bellow, you may find charts for the following protocols and ports:
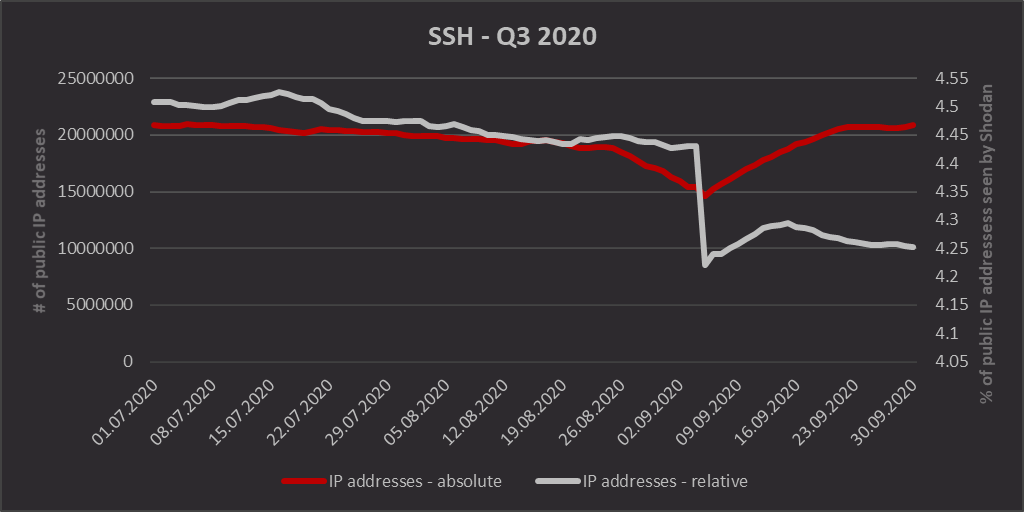
- SSH (port 22)
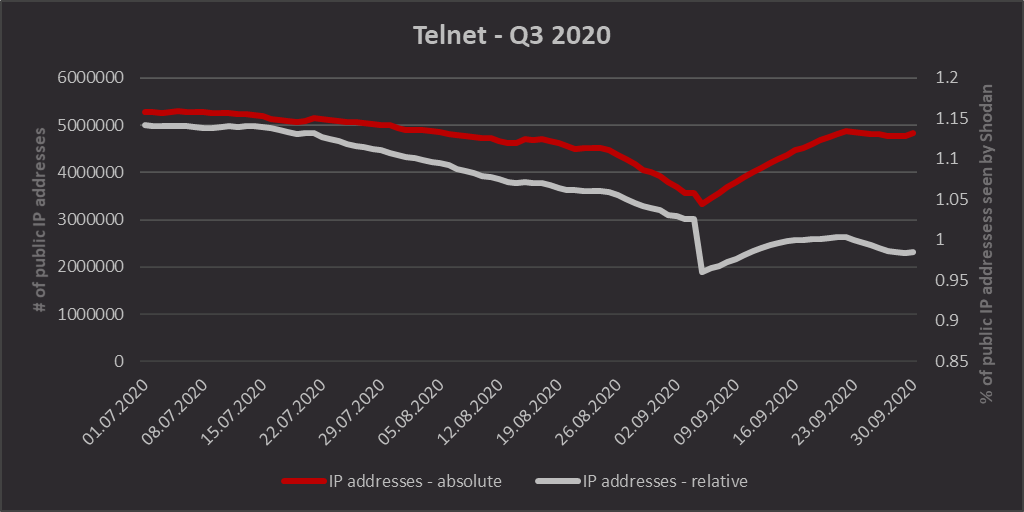
- Telnet (port 23)
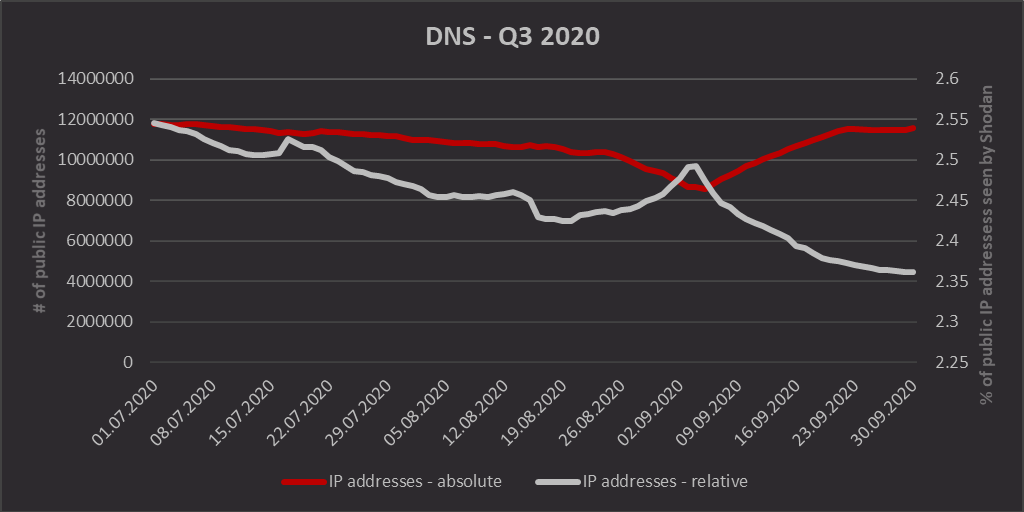
- DNS (port 53)
- NTP (port 123)
- SNMP (port 161)
- SMB (port 445)
- RDP (port 3389)
Web
Industrial Control Systems (ICS)
SSH (port 22)
Telnet (port 23)
DNS (port 53)
NTP (port 123)
SNMP (port 161)
SMB (port 445)
RDP (port 3389)
HTTP (port 80)
HTTPS (port 443)
SMTP (port 25)
SMTPS (port 465)
IMAP (port 143)
IMAPS (port 993)
POP3 (port 110)
POP3S (port 995)
Modbus (port 502)
EIBnet/IP (port 3671)
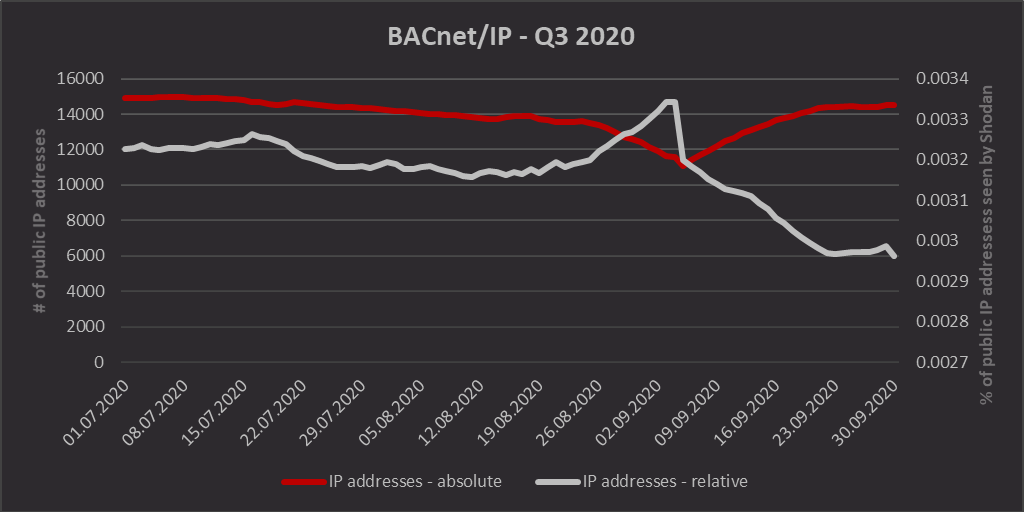
BACnet/IP (port 47808)