Last week, we took a look at Shodan results to try to determine which countries are the “richest” in the world when it comes to machines vulnerable to BlueKeep visible from the internet. Since the number of vulnerable machines Shodan detects grows every day (see the following chart), I thought it might be interesting to have another look at the numbers. But in a way which is a little different.
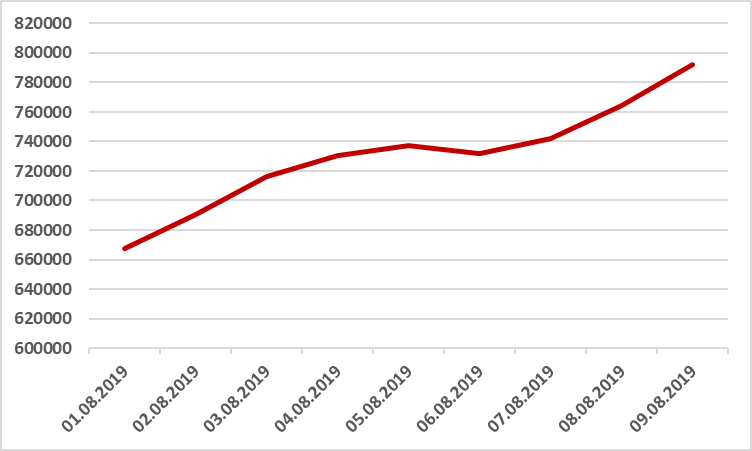
It should be mentioned that the rise in the number of affected machines is most likely due to Shodan scanning previously unscanned IP ranges and not because there are actually more vulnerable machines out there. In fact it is quite probable that a not insignificant percentage of machines shown by Shodan as vulnerable have either been assigned different IP addresses since the detection (and could therefore have even been counted multiple times) of have been patched since the detection. If you’d like to see something closer to an actual “real-time” look at the number of machines which are still vulnerable to BlueKeep and accessible from the internet, Shadowserver will probably be a better place to look then Shodan.
But that doesn’t mean that Shodan can’t still give us something quite interesting in this area.
Since very little has changed in terms of positions of different countries (see the previous post if you are interested who still has the dubious honor of belonging to the “BlueKeep Top 10 Club of Countries” as there were no changes in the first 10 places), I believe it might be more interesting to explore another aspect of the numbers, namely what percentage of machines which are accessible on the usual RDP ports (3388 and 3389) in the different countries are actually vulnerable. I quite like the idea since it could give us at least some idea of how large a percentage of all affected machines are potentially still unpatched in the countries in question.
It is true that machines directly accessible from the internet are not the best sample for “all the machines out there”, however some lose correlation between patch levels of servers accessible from the internet and patch levels of all the other machines certainly exists. One could even realistically expect that servers directly connected to the internet should be patched more often than other servers/machines so using what Shodan sees as a sample isn’t that inappropriate.
Although, since we’re listing weaknesses of this approach, we should mention that we’re completely skipping over identifying operating systems of machines behind the RDP ports and we’re counting anything with any service accessible on 3388 or 3389 as either vulnerable or patched. I.e. the following results are interesting but take them with a grain of salt.
Based on Shodan detections, of the 30 countries with highest numbers of affected machines, Hong Kong, South Korea, Argentina, China and Ukraine seem to be worse off when it comes to the percentages of machines with open RDP ports that are vulnerable to BlueKeep.
I’ve left the chart ordered by number of detected vulnerable machines in different countries so you can draw your own conclusions. The percentages themselves are in a table at the end of the post.
What seems most interesting is that although the US is second overall in the number of vulnerable machines detected (over 109k machines on the day of writing), it appears that the local patching culture is much better than in the rest of the “Top 30” BlueKeep countries as this number represents less than 3.7% of all systems with open RDP ports in the US.
This well illustrates the fact number of vulnerable systems in a certain country often doesn’t give us the whole story…
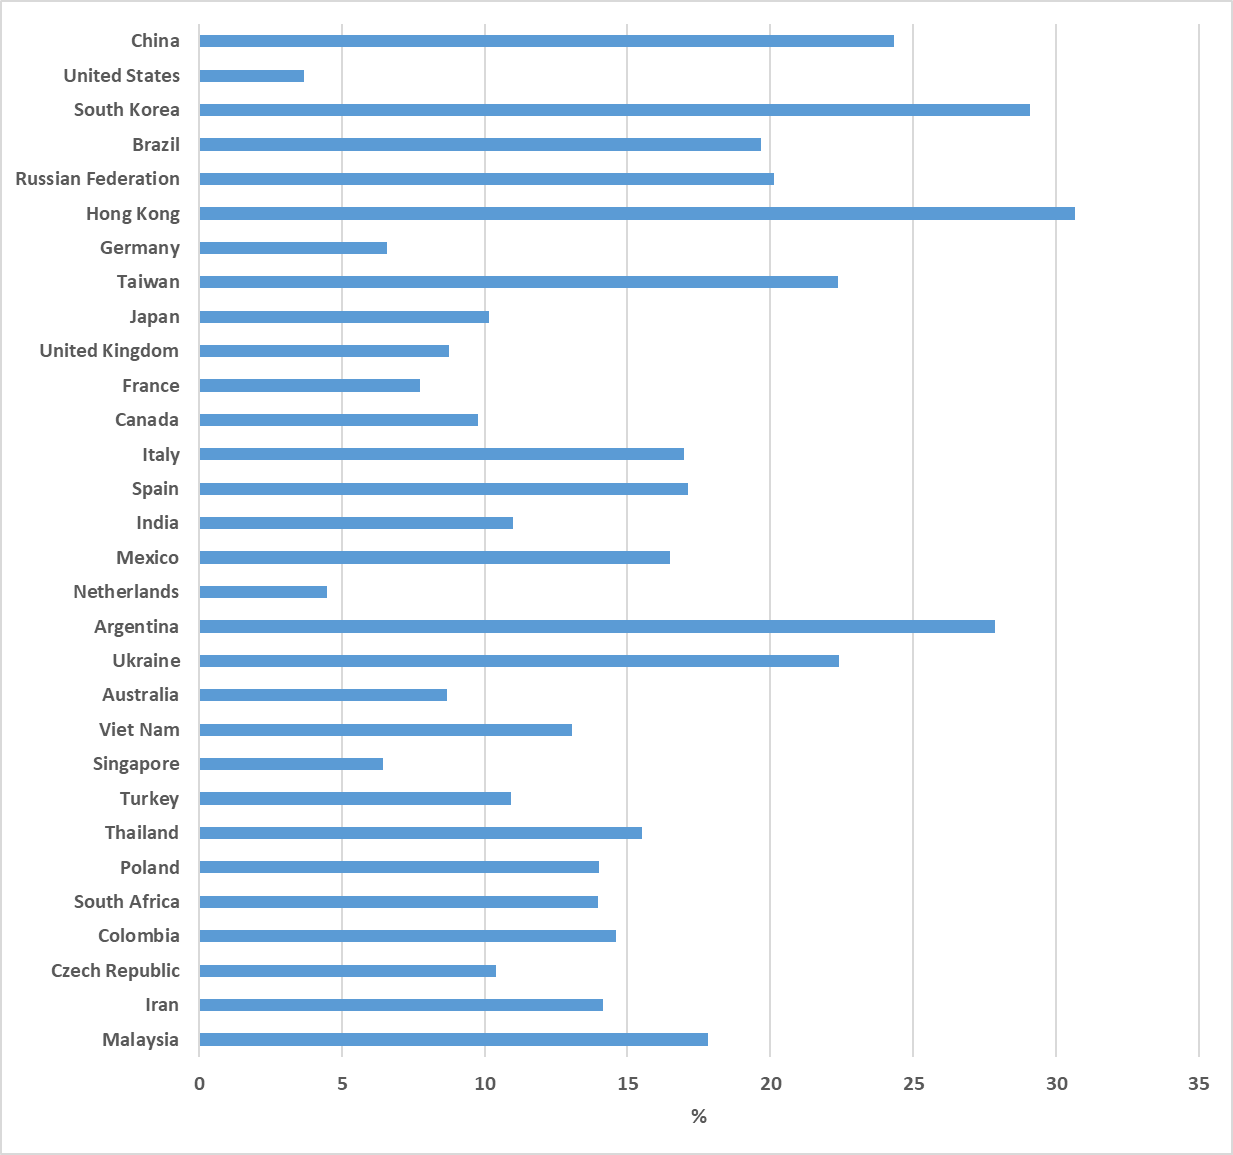
| Position | Country | Vulnerable machines | Percentage of vulnerable machines |
|---|---|---|---|
| 1 | China | 355449 | 24.34% |
| 2 | United States | 109011 | 3.67% |
| 3 | South Korea | 32300 | 29.07% |
| 4 | Brazil | 29137 | 19.66% |
| 5 | Russian Federation | 28432 | 20.12% |
| 6 | Hong Kong | 25015 | 30.67% |
| 7 | Germany | 13971 | 6.58% |
| 8 | Taiwan | 13394 | 22.36% |
| 9 | Japan | 12444 | 10.15% |
| 10 | United Kingdom | 11691 | 8.75% |
| 11 | France | 10413 | 7.74% |
| 12 | Canada | 10086 | 9.78% |
| 13 | Italy | 9585 | 16.99% |
| 14 | Spain | 9428 | 17.13% |
| 15 | India | 7732 | 11.00% |
| 16 | Mexico | 7361 | 16.50% |
| 17 | Netherlands | 6941 | 4.48% |
| 18 | Argentina | 6826 | 27.86% |
| 19 | Ukraine | 6516 | 22.41% |
| 20 | Australia | 5555 | 8.69% |
| 21 | Viet Nam | 5455 | 13.07% |
| 22 | Singapore | 5226 | 6.45% |
| 23 | Turkey | 4915 | 10.92% |
| 24 | Thailand | 4522 | 15.52% |
| 25 | Poland | 4241 | 14.01% |
| 26 | South Africa | 4175 | 13.95% |
| 27 | Colombia | 2962 | 14.59% |
| 28 | Czech Republic | 2890 | 10.40% |
| 29 | Iran | 2822 | 14.14% |
| 30 | Malaysia | 2725 | 17.82% |